 |
Aging velocity
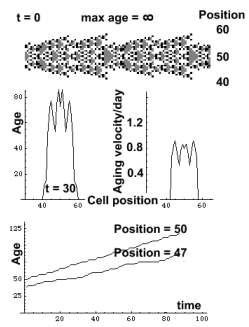
The experiment starts when CA has reached
its steady state. The experimental clock is set to
t = 0. The time unit is one day.
Max age is infinite and cells do not die. Their age distribution
at t = 30, is given below. The aging velocity distribution shows that
each cell ages at a different velocity. The lowest figure depicts aging
of cells at positions 50 and 47.
 |
 |
 |
Biological age
Chapters 11, and 12
describe the nature of biological age. Processes in our body
age at different velocities, which is most conspicuous in tissues.
Gut epithelia reach full maturity in two days, while skin epithelia mature
after three weeks. Biological age of gut epithelia advances faster than
that of skin cells. And when we die, our skin cells continue
aging (living) for hours after we have been pronounced dead. To describe
our aging we apply physical (chronological) time. In this framework ageing
is constant. Each year we age by one year.
Further reading:
Streaming tissues
Setup
zygote -> effect[1, 1000]; go[63];
restoreparams; effect[no,
1000]; go[100]; restoreparams; effect[no,
80]; go[100];