Age indicator

In chapter 56 we observed two identical CA whose initial ages were respectively 69 and 109 days. We then  determined experimentally which one was older . In both CA, age of the three left most cells was reset (injured). The subsequent CA evolution revealed which one was older. In the present experiment, we add a third  CA which will indicate the age of the other two.

The instantaneous age increment  of the mid cell (position=50) of CA-1 and CA-2 was added respectively to the mid cell age of CA-3 (marked by horizontal arrows). This addition accelerates aging of the mid cell. The graph below depicts the age of the mid cell under the control of CA-1. At t = 48 it reaches  max age, its age is set to 0 (white), and remains so.

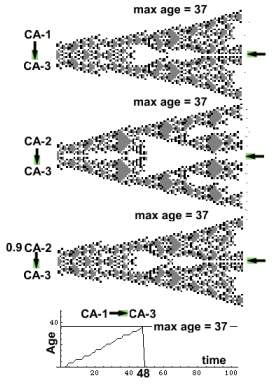
Under the control of CA-2, CA3 ages faster. CA-3 mid cell age  reaches the max age  at t = 2  its age is set to zero (white) and remains so. The entire mid cell line (position = 50) is white. In the last example CA-2 control of CA-3 is slackened. Only 0.8 of the CA-2 age increment is added to the CA-3 mid cell. Now aging proceeds at the same rate as in CA-1. We may thus conclude that CA-2 is about 1.25 (1 / 0.8)  times older than CA-1.

setup
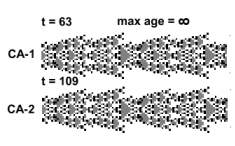
zygote -> effect[1, 1000]; go[63] (=CA-1);  zygote -> effect[1, 1000]; go[109] (=CA-2); restoreparams;  age[[3]] +=a[[3]] + toamplify a[[1, 50]]  ;age[[3]] +=a[[3]] + toamplify a[[2, 50]];  effect[no, 37];  go[100];

Previous page
Next page

Contents
Home