 |
Aging acceleration profile
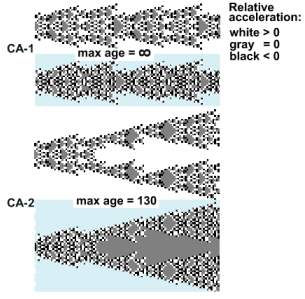
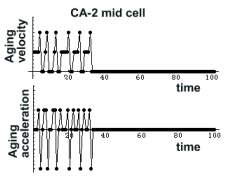
In the previous chapter CA-3 aging controlled aging acceleration of CA-1 and CA-2 . Here we explore the aging acceleration of an evolving CA. CA-1 is isolated, and CA-2 differentiates. The aging acceleration profile (distribution) is depicted below each CA.
 |
 |
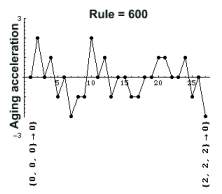
Each CA rule has a unique
aging acceleration. The graph depicts the aging acceleration distribution
of rule = 600. The abscissa represents the transformations for each triplet.
Starting with {0,0,0} -> 0, till {2,2,2}->0.
 |
CA differential
Aging acceleration profile is an analog of the linear differential.
It is the starting point for optimization problems. In the linear case you
search for a solution which maximizes or minimizes a variable. Here the
solution is an attractor.
Setup
nca=2 zygote -> effect[no 1000]; go109]; restoreparams;
effect[1 130]; effect[2 1000];
go[100];
Next page