 |
Process health
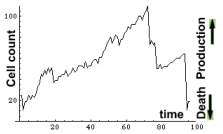
We continue to analyze the previous experiment. The curve depicts one period of a healthy system (proliferon). When cell count rises new cells are formed and added to the system. And when it declines, cells die and are released for the usage of other systems (proliferons). Number of cells produced in one period = Max[count]-Min[count]
 |
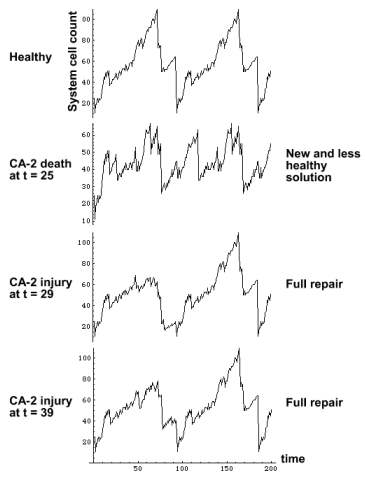
The curves below depict system cell counts of the four experiments.
 |
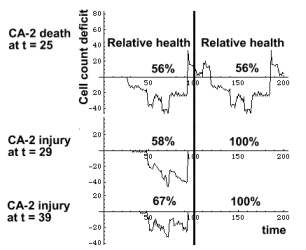
Production = Max[count]-Min[count], and production rate = production / time . Both may be applied as health or performance measures. Relative health of a system is expressed here as percentage of an uninjured system.
 |