 |
Links tuning
We continue to investigate the four
CA proliferon adjusting links between CA in order to stabilize
it. The objective is to avoid instantaneous changes like killing a CA
and allow the proliferon to set its limits, e.g., maxwidth.
maxwidth = Min[tolerance[0] / 100, 60] ; Maximal CA width
is set by CA-0
In the previous experiment CA-3 was pacing
the unit. Here it determines the maximal tolerance of CA-1.
If[ tolerance[2] > tolerance[3] - 1, reduce tolerance{2],
reduce tolerance[3]]
CA-1 and CA-3 feed CA-2 the accumulator with their
daily tolerance production:
delivery[2, 1, Min[maxwidth, tolerance[3] / 20 , 2] ;
delivery[2, 2, Min[maxwidth, tolerance[3] / 20 , 2] ;
Proliferon size depends on CA-0 tolerance. When the
CA-0 zygote is planted its tolerance = 1. As the stem process grows
it accumulates tolerance, becomes more vigorous and supports better
the other CA.
If[ p[1,prev] > p[1,now], set rule[1392]; else [set
rule[1167]]
If[ p[2,prev] > p[2,now], set rule[1392]; else [set
rule[600]]
If[ p[3,prev] > p[3,now], set rule[1284]; else [set
rule[600]]
When the experiment starts, CA-0 plants three zygotes.
The three CA switch between two rules as specified above. CA-1 delivers
its daily product to CA-2 (accumulator). CA-3 does not deliver tolerance.
The experiment lasted 4000 time units (days).
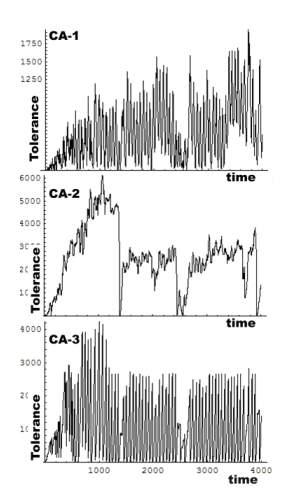 |
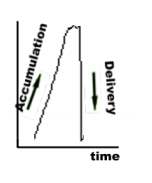
CA oscillations are linked with their output. When the curve rises the CA accumulates resources and when it declines CA releases them.
 |
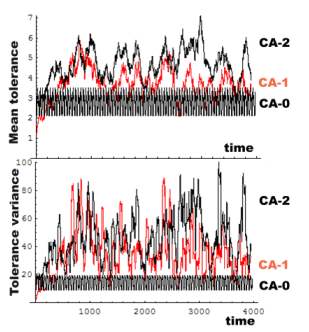
The graphs below depict a running mean of CA tolerance, and its running
variance. CA-0 is isolated and its mean and variance are the lowest.
When CA interact their mean tolerance and its variance rise. Roughly,
mean tolerance is proportional to tolerance accumulation, and variance
is proportional to output.
 |
delivery: [j, j-1, While[p[j-1]
> set point], 2]
Argument[1]: Activated CA.
Argument[2]: Activating CA.
Argument[3]: Delivery condition.
Argument[4]: Delivery amount.
p[j]: daily production