The Cancer Journal - Volume 9, Number 2 (March-April 1996)
editorial
Cancer in old age is more benign than in younger adults
Increasing cancer prevalence with age - Cancer prevalence rises with
age and in some cancers, like that of the prostate, it rises exponentially.
Every second male over 65 carries hidden and silent neoplastic foci in his
prostate, a fact that has been documented in serial autopsies of men dying
from diseases other than cancer. Cancer is a disease of the aged and is
attributed to the deterioration of the organism. Strikingly, however, it
seems to be less aggressive in old individuals than in younger adults. This
could imply that the aging organism is incapable of sustaining the exaggerated
needs of a neoplasia which therefore slows down. On the other hand, what
if the elderly organism deliberately slows down cancer progression ? Since
aging is regarded as a deterioration, such a possibility has never been
considered but one should not too readily ignore the wisdom of the aging
body and how it handles diseases (1). That aging is a deterioration seems
to be supported by the rise in cancer prevalence. In a decaying organism,
more cells become neoplastic and prevalence rises. But is this necessarily
true and couldn't the rise also reflect a decline in cancer aggressiveness
?
Two illustrations - There are two possible explanations for the rising
prevalence of cancer. The obvious one is that more and more cells in the
body become neoplastic; the less obvious one is that the cancer becomes
less aggressive. The second proposition seems to go against the grain. How
can a less aggressive cancer become more prevalent than an aggressive one
? The answer lies in two simple diagrams illustrating cancer progression.
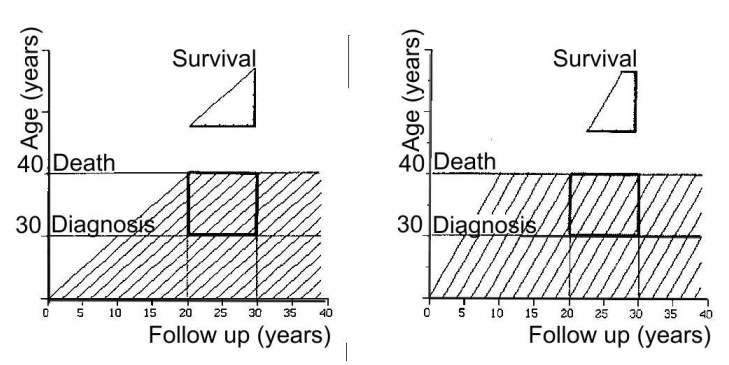
In Figure 1, each of the diagonal lines - called life lines - represents
an individual with cancer. Each line begins when a cell becomes neoplastic
and the tumour starts to grow. After a while, when the tumour is detected
and diagnosed, the life line crosses the horizontal line or threshold, labelled
"Diagnosis", that marks the transition of the cancer from its
preclinical to clinical phase. When the life line hits the upper threshold
labelled "Death", the patient dies.
We shall study the fate of patients in the area outlined by the bold square
and covering a 10-year period. First of all, let us have some definitions
: 10-year cancer incidence is the number of life lines crossing the diagnosis
threshold in 10 years (5 lines); 10-year cancer mortality is the number
of life lines crossing the death threshold in 10 years (5 lines); 10-year
cancer prevalence is the total number of life lines in the square (9 lines).
Patient survival is defined as the time it takes for a life line that has
crossed the diagnosis threshold to reach the death threshold. Overall survival
is estimated in life lines that cross both thresholds in the square. It
is important to note that some do not cross the diagnosis threshold and
that some do not cross the death threshold and that these life lines are
ignored or, as the epidemiologists say, 'censored' in the assessment of
survival. The representative life line used to measure survival is drawn
in the upper part of the figure and labelled "Survival". Now let's
look at Figure 2. Ten-year incidence and mortality are given by 5 life lines
(as in Figure 1). Ten-year prevalence is given by 7 life lines (two less
than in Figure 1) indicating that cancer is less prevalent in Figure 2 than
in Figure 1. It is, however, more aggressive since, in Figure 1, patients
survive 10 years whereas, in Figure 2, only about 7 years ! A more prevalent
cancer may therefore be less aggressive.
 |
High cancer prevalence may indicate a less aggressive cancer - In
these diagrams, the spacing between the life lines does not change. However,
if the life lines became denser with age in order to account for a decaying
body, cancer prevalence would also rise. Thus, the diagrams can illustrate
two possible interpretations for a high cancer prevalence involving either
a less aggressive (see above) or more aggressive (denser lines) cancer.
Needless to say, these diagrams are over-simplifications and cancer progression
is, in reality, non linear (it is Gompertzian). Despite this restriction,
however, the conclusion nevertheless remains valid.
Diagrams such as these are used in demography but only seldom in cancer
epidemiology. They illustrate that cancer is an ongoing process and that
it follows a trajectory that needs to be considered in its entire complexity.
Epidemiologists represent the cancer life line by only three events - incidence,
mortality and prevalence - which do not suffice to explain the true nature
of prevalence. The life lines in Figures 1 and 2 differ in their slopes,
i.e., in their tumor growth rates. The steeper the line, the more aggressive
the cancer, whatever the prevalence. Since epidemiologists do not estimate
slopes, they cannot interpret properly the meaning of a rising cancer prevalence.
Epidemiology spreads disinformation - Epidemiology maintains that
the rising cancer prevalence indicates a mounting cancer aggressiveness
but this flies into the face of the opinion of many clinicians who feel
that.cancer in old age is, on the contrary, less aggressive but who are
muted by the "solid scientific facts" put forward by the epidemiologists.
Our example thus illustrates how epidemiology can spread disinformation
and iatrogenesis (2-7). Epidemiology may be rescued from its confusion by
recognizing the limitations of its tools or by adopting means for studying
cancer progression, e.g., life lines. Until then, clinicians are advised
to distrust epidemiology.
Wisdom of the aged body - Several findings indicate that cancer in
old age is less aggressive : Age-specific cancer incidence and mortality
from chronic cancers, e.g., breast and bronchus, decline in advanced age
(8); tumor growth rates taper off (9). The dogma of the decaying body should
thus be abandoned and attention turned instead to its wisdom (1). We ought
to realize that aging and cancer are two independent processes and that
the aging body manages somehow to slow down cancer progression. Since cancer
growth rate declines, cancer becomes less aggressive but more prevalent.
For instance, in many patients, prostate cancer seems to be arrested at
an early stage to be discovered only at autopsy after death by non-cancer
related diseases. The same wisdom of the aged body allows women with stage-2
breast cancer to live with undetected micrometastases for years in good
health (10). The aging body knows how to live with cancer. What is its secret
? Canguilhem would say that cancer in old age is a new life and that there
are secrets that are waiting to be explored (11, 12).
1. Zajicek G. Wisdom of the body. Cancer J 7, 212-213, 1994.
2. Zajicek G. Progress against cancer: are we winning the war? Cancer J
3, 2, 1990.
3. Zajicek G. Cancer wars. Cancer J 4, 4-5, 1991.
4. Zajicek G. Meta-analysis and chaos. Cancer J 4, 152-153, 1991
5. Zajicek G. To smoke or not to smoke? Cancer J 5, 70, 1992
6. Zajicek G. Epidemiology spreads disinformation. Cancer J 5, 240, 1992
7. Zajicek G. Does smoking cause suicide? Cancer J 6, 4, 1993.
8. FW McKay, MR Hanson, RW Miller. Cancer mortality in the U.S.:1950-1977,
NIH Publ. No. 82-2435, 1982 .
9. Tubiana M. LH Gray Medal Lecture: Cell kinetics and radiation oncology.
Int J Radiat Oncol Phys 8, 1471-1480, 1982.
10. Zajicek G. Wisdom of the body in cancer. Cancer J 7, 96-97,1994.
11. Zajicek G. The normal and the pathological. Cancer J 7, 48-49,1994.
12. Canguilhem G. Le normal et le pathologique. Translated into English
by Fawcett CR, Cohen RS. Zone Books, New York, 1991.