
|
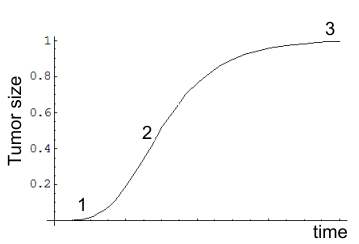 |
Initially the tumor grows exponentially until crossing the
inflection point at 2 whereupon its growth decelerates. As the tumor
grows its core lacks oxygen and becomes necrotic. When the rate of growth
equals the rate of death (necrosis) tumor size remains constant. Recently
Gompertzian dynamics were reviewed by Waliszewski (3), and applied by Riffenburgh, and
Johnstone to the analysis of cancer survival curves (4).
Cancer is viewed here as a metabolic
deficiency and the present model illustrates the relationship
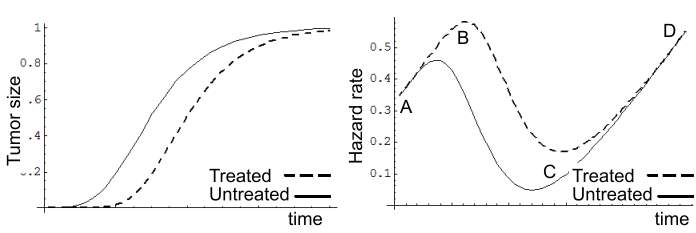
between the metabolites A, B and the bi-modal hazard rate. The left graph
depicts the change of the two metabolites with time. A declines linearly.
At a certain point it triggers the formation of a tumor that
produces a substitute called here B
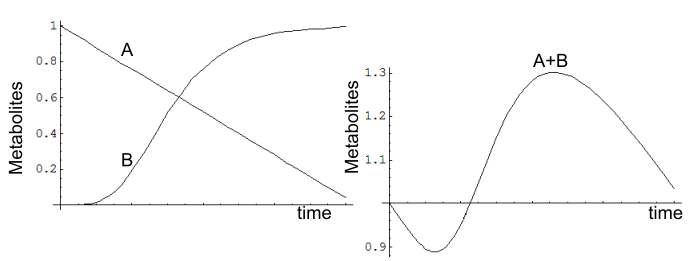 |
The graph on the right depicts the total metabolite level. The deficiency starts with a decline of A. At a certain point the low metabolite level triggers the formation of the tumor. Nevertheless the deficiency worsens, since the tumor is still too small to replenish fully the missing substance. When the tumor catches up, the disease is compensated and the patient feels healthy. Gradually necrosis intensifies and B production by the tumor declines.
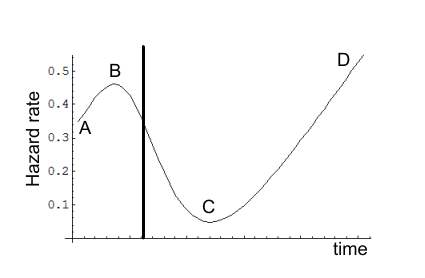
The next graph depicts the hazard rate = (1 normalized total metabolite level).
 |
 |
When the tumor is small the hazard
rises (AB). Then it declines to the level when cancer was
diagnosed (marked by the vertical line). At point C the deficiency
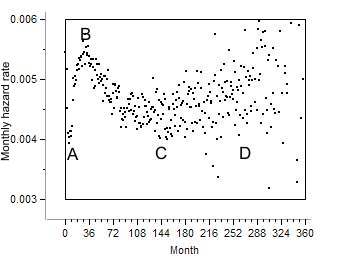
becomes severe and the hazard rate rises. The right graph depicts hazard
rates of regional breast cancer.
When lung cancer is diagnosed the disease is somewhat more
advanced than in breast cancer and the hazard
rate declines . The vertical line indicates when lung cancer was detected.
The AB segment appears in cancers that are detected relatively
early, e.g., breast, or uterus
.and is missing in cancers that are detected later, e.g.,
pancreas.
Treatment
Only rarely does cancer treatment eliminate the entire tumor. If it does the
hazard rate rises more than in an untreated
disease . The tumor residues start growing and finally replenish the missing
metabolite. Since their growth is postponed, the deficiency deepens and the
hazard rises (right figure).
 |
The model illustrates the close
association between tumor growth and hazard rates.
References
1. Laird, A.K. Laird, Dynamics of tumour growth,
Br. J. Cancer 18 (1964), pp. 490502.
2. Laird, A.K. et al., , Dynamics of normal growth,
Growth 29 (1965), pp. 233248.
3. Waliszewski P
A principle of fractal-stochastic dualism and Gompertzian dynamics of growth
and self-organization
Biosystems 82
(2005), pp. 61-73
4. Riffenburgh, RH, Johnstone, PAS Survival Patterns of Cancer Patients
Cancer 91
(2001), pp.246975.