1. Bi-modal hazard rate
2. A declining hazard rate from the third year and on.
Hazard rates of recurrence following diagnosis of primary breast cancer
Ismail Jatoi1 , Anna Tsimelzon , Heidi Weiss , Gary M. Clark and Susan G.
Hilsenbeck
Breast Cancer Research and Treatment 89: 2 2002 pp 173-178
 |
 |
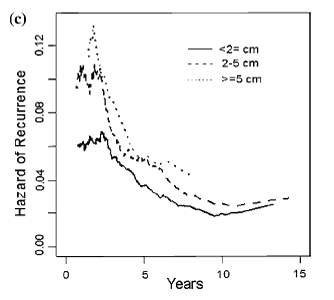 |
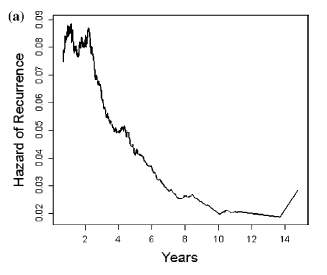
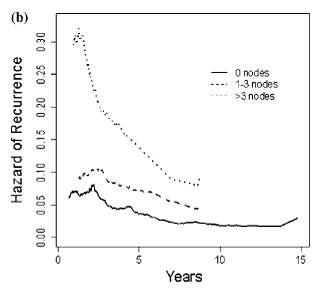
Figure 1. Hazard function for the time of recurrence produced
with Nelson–Aalen
method: (a) all patients; (b) patients with different number of nodes
involved; c) different tumor size (cm)
The curves display a bi-modal hazard that declines from the third
year and onward. The hazard is proportional to the number of involved
lymph nodes, and tumor size. From the third year and on hazard rate continually
declines.
--------------------------------
Breast Cancer Mortality Trends in the United States According to Estrogen
Receptor Status and Age at Diagnosis
Ismail Jatoi, Bingshu E. Chen, William F. Anderson, Philip S. Rosenberg
Journal of Clinical Oncology, Vol 25, No 13 (May 1), 2007: pp. 1683-1690
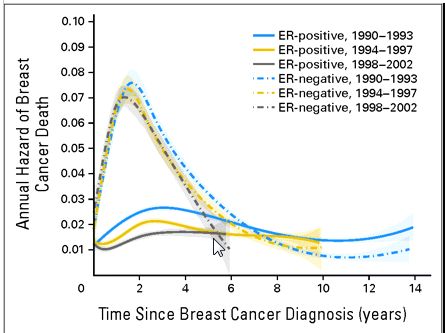
According to the hypothesis presented here, peak
height is proportional to tumor dependence of the patient. The higher
the peak the more dependent she is. As the tumor evolves it becomes
less and less differentiated (more anaplastic). ER positive tumors
are therefore younger than ER negative