
|
The data source
Surveillance, Epidemiology, and End Results (SEER) Program (www.seer.cancer.gov)
SEER*Stat Database: Incidence - SEER 9 Regs Public-Use, Nov 2004 Sub (1973-2002),
National Cancer Institute, DCCPS, Surveillance Research Program, Cancer Statistics
Branch, released April 2005, based on the November 2004 submission.
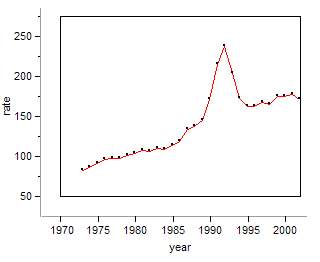
The first figure depicts age adjusted prostate incidence. It illustrates an
artificial epidemic of prostate cancer that started in the 90s when PSA testing
became widespread. Compare it with a similar epidemic
of breast cancer.
 |
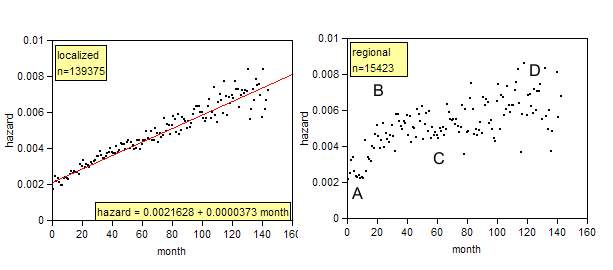
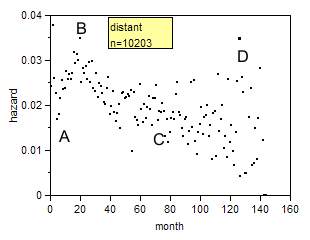
The following calculations were made on patients diagnosed after the year
1990 when the epidemic started. The hazard rate of localized cancer ascends
linearly with a slope steeper than in the healthy population. Regional cancers
hint a bi modality which becomes obvious in distant cancer
 |
 |
Further reading Watch your prostate