
|
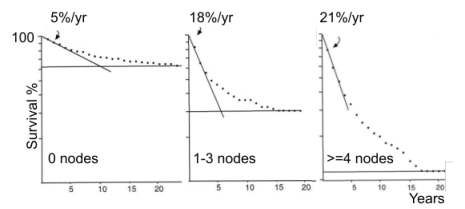 |
Following diagnosis survival declines rapidly and gradually levels off. This
pattern is an epidemiological hallmark of cancer. It can be summarized
by the following statement The longer you live the better your chances to
survive and is explained elsewhere.
The slope of the line is its survival derivative, which
is closely related to the hazard rate. It indicates that about three years
following treatment the hazard is relatively high and declines afterwards,
like in this figure.
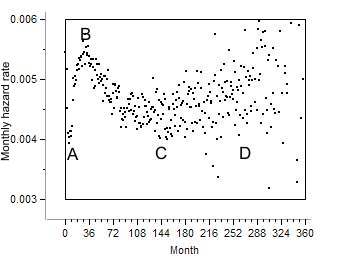 |
The rising hazard following treatment indicates that the
patient depends somehow on her tumor
. The survival slope is shaped by two factors: 1. Disease progression
and 2. Treatment. As cancer progresses the patient depends more and more
on her tumor, the survival slope becomes steeper and the hazard rises.
The therapeutic implication is straight forward: As long as tumor does
not impinge upon a vital function and does not cause pain or suffering it
ought to be left intact. Treatment ought to preserve the tumor and alleviate
its secondary manifestations.
Additional reading:
Pernicious cachexia
Metastasis following treatment
Bi-modal hazard rate
WOB
controls cancer
References
1 Ruth Heimann,
Samuel Hellman
Clinical Progression of Breast Cancer Malignant Behavior: What to Expect and
When to Expect it.
Journal of Clinical Oncology,
Vol 18, Issue 3 (February), 2000: 591