
|
|
ANTICANCER RESEARCH 19:4907-4912
(1999)
0 Contents
1 Summary
2 An amazing statistic
3 Breast cancer progression
4 Cancer is a systemic disease
5 The declining hazard rate of breast cancer
6.1 An intuitive explanation of the statistical method
6.2 Material and method
6.3 Results
6.3.1 Aging hazard, ma
6.3.2 The cancer hazard declines with time, mc' <0
7 The declining hazard is inversely correlated with the growing tumor
8 Breast ablation is followed by a rising hazard rate
9 Long survival with micrometastasis
10 When to treat?
11 Tumor as protective organ
12 References
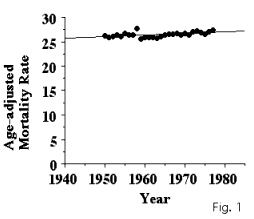
Despite intensive effort to cure breast cancer, treatment generally
fails, as evidenced by the age adjusted mortality from breast cancer.
For 60 years, breast cancer mortality remained virtually constant. As
treatment failed to improve the life prospect of the average patient,
it is based on false premises, e.g., Halsted's hypothesis, according to
which the tumor is the only threat to the patient. Yet there is more to
cancer than just the tumor. Two hallmarks of cancer, cachexia, and
paraneoplasia, are usually ignored, since it is assumed that they
are caused by the tumor. But, what if it is the other way around, and
cancer is first of all a cachexia accompanied by a tumor? At least
this could explain why in most cancers treatment fails.
Cancer is a chronic systemic disease with local manifestations. Like
arteriosclerosis, that is also systemic and manifested solely by its local
manifestations, e.g., stroke and myocardial infarction. In the same way
as treatment of an ailing heart does not cure the underlying arteriosclerosis,
tumor removal does not cure cancer, since being "metabolically" systemic.
It is proposed here that carcinogens, deplete a vital substance
and induce a metabolic deficiency that ends in cachexia. In order
to survive, the organism grows a protective organ, the tumor, that replenishes
the missing substance. During pre-clinical phase of cancer, deficiency
is slight and compensated even by a minute tumor. With time it gets worse
and the tumor has to grow more and more in order to make up for the loss,
causing pain and secondary damage to vital functions. The patient seeks
help and the disease starts its clinical course. When deficiency worsens,
the patient becomes cachectic and dies.
Such a metabolic relationship exists in pernicious anemia, that illustrates
how a tumor might be protective. Cancer is viewed here as pernicious
cachexia induced by the loss of a vital metabolite and compensated by
the tumor. Until the discovery of the missing substance, treatment
ought to preserve the tumor and alleviate its secondary manifestations.
 |
Tumor progression is described within two frameworks: biological and
clinical The first describes solely the behavior of the breast tumor.
The second, deals with clinical manifestations of breast cancer: Initially
the tumor is a non invasive, "in situ carcinoma". It then proceeds
through three invasive stages: 1. Localized, when tumor is confined
to the breast, 2. Regional, when tumor cells enter regional lymph
nodes, and 3. Distant, when tumor cells spread into remote organs.
The disease starts when a normal cell becomes malignant. Initially the
tumor is small and cannot be detected by available diagnostic tools, and
the disease proceeds through its pre-clinical phase. On tumor detection,
the disease starts its clinical phase. The two frameworks do not
overlap. A tumor may reach its invasive stage during pre-clinical stage,
long before diagnosis. In the year 1990, only 11.7% of breast tumors detected
in the U.S. were non-invasive, 42.5% were localized, and 45.8% spread
outside the breast (Table 1, (3, p.I.21)).
Biological (stages) |
||
| Non-invasive | In situ carcinoma | 11.7% |
| Invasive | 1. Localized | 42.5% |
| 2. Regional | 33.6% | |
| 3. Distant | 09.0% |
Clinical (phases) |
|
| 1. Inception | |
| Pre-clinical phase | |
| 2. Detection | |
| Clinical phase | |
_____________________________________
Stage classification was adapted from (3, p. I.21). Stages 3 and 4 are pooled.
3.3% were unclassified (3, p. IV.17).
There is more to cancer than just the tumor. Two hallmarks of cancer,
cachexia, and paraneoplasia, are usually ignored, since it is assumed that
they are caused by the tumor. In some cases it appears as if cachexia and paraneoplasia
accompany the tumor, yet usually weight loss does not correlate with the type
of cancer and its duration, nor with the site or number of metastases (4). Weight
loss is one of the earliest manifestations of malignancy (5), and cachexia can
appear in patients with tumors that are less than 0.01% of the total body weight
(6). Also paraneoplasia is unrelated to tumor size, location, or the degree
of metastasis, and may antedate the discovery of the tumor by weeks, months,
or even years (7). In spite of this, oncology maintains that tumor is the primary
factor in cancer, and systemic effects are secondary. But, what if it is the
other way around, and cancer is first of all a cachexia accompanied by the
tumor? At least this could explain why in most cancers treatment fails.
Take for instance arteriosclerosis that is manifested by local phenomena,
e.g., stroke and myocardial infarction, and yet is essentially systemic. The
same could apply to cancer, which like arteriosclerosis is "metabolically" systemic,
and presents itself also by local phenomena, e.g., tumor. In the same way as
treatment of an ailing heart does not cure the underlying arteriosclerosis,
tumor removal does not cure cancer.
The following epidemiological analysis reveals that this might be the
case, and more:
1. Cancer starts as a systemic disease (systemic like arteriosclerosis)
2. Throughout its clinical phase, the patient's resistance to cancer continually mounts, until his reserves are exhausted and she dies.
3. Most breast cancer patients carry silent micro-metastases without clinical manifestations.
4. Following breast ablation in patients with regional breast cancer, the disease gets worse and their resistance declines.
5. There is enough epidemiological evidence to indicate that the patient depends on her tumor, and needs it for surviving cancer.
An outstanding phenomenon in cancer epidemiology lies hidden and buried
in piles of statistical data that are published yearly. Despite that cancer
is generally incurable from the time of its first clinical manifestation, along
its entire course, the chances of the cancer patient continually improve
(8,9). The chances of the patient are concisely represented by the cancer
hazard rate m[c] that is defined as the probability per unit time, that
an individual who has survived to the beginning of a given time interval, will
die within that interval. Thus from the first clinical inception of cancer its
hazard rate continually declines.
This phenomenon is most pronounced in patients who survive longer than
three years. It was documented in breast cancer patients, e.g., in patients
treated at the M.D.Anderson Hospital (10), in 3878 patients from Edinburgh (11,12),
in 1141 patients from the Charity Hospital of Louisiana (13) and in 57,068 patients
from Sweden (14). Some reports provide "conditional annual survival rates" instead,
i.e. the chance that an individual who has survived until time "i" will live
for another year. These reports bear witness to the same favorable outcome.
In Norway the conditional survival of 14,731 patients with breast cancer improved
from year to year (15), and so did the conditional survival of patients with
other cancers, e.g. cervix, corpus, lung and prostate (16).
In all other chronic diseases as well as in the healthy population, the
hazard rate continually rises (9).
Epidemiologists disregard this phenomenon ascribing it to a bias resulting from patient grouping. As some cancer patients will eventually be cured, while others continue dying, the group as a whole gets healthier. The same putative grouping bias should operate also in chronic non-cancerous diseases and in healthy individuals, yet their hazard rate continually rises.
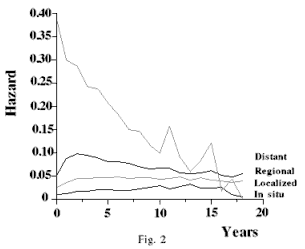
Figure 2 depicts hazard rates of patients with breast cancer. When studying
the four curves please note the magnitude of the hazard when cancer was diagnosed,
and its direction in subsequent years, whether it was rising or declining.
In situ cancer starts with the lowest hazard that rises until the 12th year.
The initial hazard of localized cancer is somewhat higher. Initially it rises
and then remains constant. The hazard of regional cancer rises up to the third
year, whereupon it continually declines. When patients with distant cancer are
first diagnosed, their hazard is about 0.39, and it continually declines.
When diagnosed, a patient with distant disease, has a chance of 39% to die
within a year. If surviving, her chance to die within the next year drops to
30%. By the 10th year, her chances to die within the subsequent year drop to
about 10%. From year to year her chances to survive improve. Apparently her
organism learns how to cope with the disease better and better. Unfortunately,
her reserves do not suffice to cure herself, and she dies. In localized, and
regional cancers, hazard rate starts to decline from the third year and onward.
The longer they live, the better their chances to survive. A declining
hazard is manifested only in cancer. In other chronic diseases, as well as in
the healthy population, the hazard continually rises. In healthy individuals
the hazard is much lower than in cancer, yet it rises. This trend is apparent
in in-situ cancer (Fig. 2). You may remember that patients with in-situ cancer
do not die from cancer, otherwise they would not have been grouped in this category.
Their hazard thus follows that of non-cancerous diseases. In the statistical
analysis. in situ cancer hazard, m[a], is confronted with the cancer
hazard, m[c].
The observed hazard of a patient, m[o] is made of two components, hazard
due to cancer, m[c], and due to other diseases, m[a], and, m[o]=m[c]+m[a].
In distant cancer all patients die from cancer, and m[c] >> m[a].
In other words the declining m[o] is due to cancer. Since in-situ cancer patients
do not die from cancer, m[c] = 0, and their rising hazard is contributed
by non cancerous diseases, m[o]=m[a]. Mathematically speaking, the derivative
of a rising hazard is positive, and that of a declining hazard, negative. Which
can be expressed as follows: m[c]' < 0 m[a]' > 0. A rigorous proof
of these arguments is given in the subsequent sections.
Computations were made from the SEER August 1993 public-use data files
(17). The cases were diagnosed in 1973-91. The patients selected for this study
were female Caucasian (report item number 9: Race Recode = 1). Cancers were
staged into: in situ, localized, regional and distant (report item no 27: Historic
Stage). Ages were grouped into five year interval groups (report item number
26: AgeRec). AgeRec= |Age/5|+1. File handling and statistical analysis was made
with the JMP package version 3.1 (SAS Institute Inc. Cary, NC). The Kaplan-Meier
(Product-Limit) analysis was used for computing cumulative survival and hazard
rates. Patients with unknown survival time were excluded (report item number
28: 9999=unknown). The selected data set consisted of 198,623 patients
(Table 2). Patients alive at cutoff date were censored, otherwise no censoring
was done. A patient was included even if the cause of his death was unknown.
The yearly hazard rate m = (Number that failed) / (Number at risk). The in-situ
cancer hazard rate was subtracted from the hazard of clinical cancer. Log-hazard
rates were then computed for different age groups (AgeRec), cancer stages (Stage)
and years of survival (Years), ( 3 < Years < 16). These were then fitted
by a least square model (Table 3).
|
Stage
|
Mean age
|
Standard deviation of age |
N
|
| In situ carcinoma | 58.8 |
13.5 |
15,687 |
| Localized | 65.8 |
14.9 |
102,280 |
| Regional | 64.6 |
15.9 |
68,341 |
| Distant | 66.5 |
13.6 |
12,315 |
| Total |
198,623 |
||
Table 3 Parameter
Estimates of the linear model:
LNhaz = intercept + b1*Stage + b2*AgeRec + b3*Years
|
Intercept
|
b1
|
b2
|
b3
|
r-square
|
N
|
|
|
Parameter estimates |
-5.8
|
0.59
|
0.173
|
-0.024
|
0.72
|
279
|
| Prob > |t| | 0.00005 | 0.00005 | 0.00005 | 0.00060 | ||
| Effect test | ||||||
| Prob > F | - | 0.00005 | 0.00005 | 0.00060 | ||
 |
The data set consisted of 198,623 female Caucasian patients. With rising
stage survival of breast cancer was poorer, and the hazard rate rose (Fig. 2).
The hazard rate of in situ cancer started at 0.01. It climbed up till the 13th
year whereupon it declined. The hazard rate of localized cancer started at 0.03,
and till the third year it climbed up, whereupon it declined very moderately.
In the figure the decline is not so obvious, but was statistically significant
(Table 3). In regional cancers this bi-phasic trend was conspicuous. The initial
hazard rate was 0.05. By year 3 it reached 0.09, and declined thereafter. The
hazard rate of distant cancers was the highest, 0.39, and declined along the
entire observation period.
The subsequent analysis and discussion will be restricted to hazard rates
observed between the years 4 and 15 (3 < Years < 16). Patients with in-situ
cancer do not die from cancer, otherwise they would have been included in one
of the other groups. Their hazard stands for death due to aging and non-cancerous
diseases = m[a]. The other three stages represent clinical cancer. Their observed
hazard m[o] consists of two components: Hazard due to cancer m[c] and hazard
due to aging and non-cancerous diseases m[a]. m[o] = m[c]+ m[a]. In in-situ
cancer m[o]=m[a]. Since all stages are affected by the same aging hazard m[a],
the in-situ hazard may substitute for the aging hazards of clinical cancers,
and m[o] = m[c] + m[in situ].
In in-situ cancer the hazard rate continually rose. In the other three
stages, the hazard rate in the interval 3 < Years < 16, declined. Since
m[o] = m[c]+ m[in situ], and since m[in situ] rose, we may conclude that m[c]
declined. In other words, in the time interval 3 < Years < 16 , the aging
hazard rate derivative was positive m[a]' > 0 , and the cancer hazard
rate derivative was negative m[c]' < 0). This statement was confirmed
also by the least square model.
First, the in-situ hazard was subtracted from the observed clinical
cancer hazards m[c] = m[o] - m[in situ]. The model was:
LNhaz = intercept + b1*Stage + b2 *AgeRec+ b3*Years
(1 =< Stage =< 3), (8 < AgeRec < 17), (3 < Years < 16) (Table 3). The slopes of AgeRec and Stage were positive, and the slope of Years, negative. This completes the proof of the opening hypothesis:
1. The observed cancer hazard consists of two components mo=mc+ma, and
2. The derivative of the aging hazard is positive m[a]' > 0 , and the derivative of the cancer hazard is negative m[c]' < 0 . Although breast cancer is generally deadly, from the third year after its diagnosis and onward, it is manifested by a declining hazard.
As cancer evolves the patient gradually deteriorates, he loses weight,
develops paraneoplasia, and cachexia. These, obviously cannot account for the
declining hazard and his improving chances. Attention should therefore be turned
to the tumor. The declining hazard is inversely correlated with tumor growth.
This is most pronounced in patients with distant disease. As metastases accumulate,
the hazard declines. Once the tumor affects vital functions, hazard starts
rising and the patient dies. Most tumors of patients with localized and regional
cancer are clinically silent, manifested by a lump in the breast that does not
cause pain. While in all other ailments pain and discomfort drive the patient
to seek help, the cancer patient is not aware of her disease, and has to be
screened. The hazard of these patients is depicted in Figure 2. As the disease
progresses, the tumor grows and the hazard declines. The patient depends
somehow on her tumor. More, the following analysis reveals that when the
tumor is removed she gets worse.
The hazard rate of patients with regional breast cancer is bi-phasic
(Fig. 2). Up to the third year it rises, whereupon it declines. The hazard
of localized breast cancer follows a similar pattern although less pronounced.
All patients were treated when cancer was diagnosed, why should their condition
deteriorate? Their fate was determined by their dependence on their tumors.
Those who depended the most, died and the group hazard rose from 0.05 to 0.10.
Patients who at that time of surgery had metastasis, were less dependent on
their tumor, and their hazard rate declined. Patients with distant disease were
entirely independent of their primary tumor, and their hazard declined despite
treatment.
Tumor dependency explains why following surgery the condition of many patients
aggravates, e.g., following colectomy for colon cancer, when the liver becomes
seeded with metastases. In the past, this was attributed to tumor seeding induced
by the surgical procedure. Yet the present analysis suggests a different explanation.
As cancer progresses, organism and tumor maintain an equilibrium (homeostasis).
When deprived from his primary tumor, the organism attempts to restore equilibrium,
and induces micro-metastases to grow faster, until the missing tumor mass has
been replenished.
Additional reading:
Recent epidemiological analysis with
new data
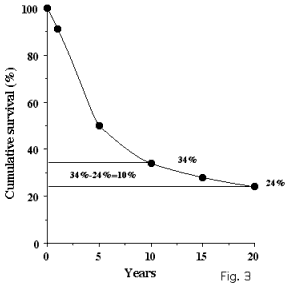 |
The cancer survival report No. 5 from the US National Institutes of Health
describes the survival of 3369 patients with regional breast cancer diagnosed
during 1950-1954 (18). Treatment consisted of mastectomy with or without irradiation.
Their fate is depicted in Fig. 3. Initially the curve declines steeply, and
gradually levels off. With time less and less women died, and indeed their hazard
declined. Yet here we are interested in a different epidemiological feature.
While 76% patients succumbed to the disease, 24% survived 20 years. Most
of the time they were in remission and healthy. Since they eventually died from
their disease, we can conclude retrospectively that all carried undetected
micrometastases. Take for instance a woman that died after 20 years. Most
of the time she was, and felt healthy, otherwise she would have been treated.
During this prolonged remission her organism apparently "knew" how to live
with, and adapt to micrometastasis. Let's examine the fate of 10% women
that died in the period between 10-20 years. 34% survived 10 years, and 24%
survived 20 years. 10% thus died from breast cancer between the year 10 and
20. Since living at least 10 years we may conclude that they carried hidden
micro-metastases 10 years. For most of these years they were healthy otherwise
they would have been treated. Micro-metastasis itself may not be harmful,
and it might be even protective.
In the U.S., 33.6% of white females with breast cancer have regional disease
(18 p. IV.17). The age adjusted incidence for all stages was 113.6/100,000.
(19, p.117). 38/100,000 females carried micrometastases at least 10 years (=
0.336*113.6) which makes about 9,500 patients per year in the entire country.
This estimate is extremely conservative. Actually, thousands of apparently healthy
females carry micro-metastasis at least 10 years. Should they be poisoned with
adjuvant chemotherapy? The nature of this adaptation to micro-metastasis is
still unknown. Suppose medicine could harness it enabling the woman to live
for another 20 years, cancer would turn into a benign disease. We may thus conclude
that unless a metastasis impinges upon a vital organ, it is relatively harmless
(20).
Even if one dislikes the idea that the patient might depend on her tumor,
time has come to reconsider treatment objectives, and strategy. As long
as a tumor or metastasis are clinically silent they should not be treated. From
the time of its inception cancer is systemic, and a local cure is of no avail.
Treatment is indicated only if a tumor causes discomfort, pain, or impinges
on a vital function. In the past, mastectomy was a life saving procedure that
protected the patient from infection and sepsis. Today we have time to wait
and postpone the mutilating mastectomy, knowing that the patient's hazard continually
declines. Treatment should be on an ad hoc basis. Some patients are anxious
to get rid of the tumor which may be achieved in a gentler way than by mutilating
mastectomy. Above all, they ought to be told the truth, that they carry a wide
spread disease, but their chances continually improve.
Since apparently cancer is not yet curable, we ought to aim at prolonged
remission. Exactly as done in all other chronic diseases. We never promise
to cure a patient with an heart ailment, saying to him: "Your pump is somewhat
damaged, yet with proper exercise you might participate even in the 'cardiac
marathon'". Why not encourage the cancer patient saying to him: "You got cancer,
it may be generalized, yet with proper . . . . you will be able to run for president".
Here we are stuck, since all we know is to cut and poison. The declining
hazard indicates that the patient is mobilizing her defense, and we ought to
learn how to help her in this endeavor.
It is proposed here that carcinogens, deplete a vital substance, inducing
a metabolic deficiency that ends in cachexia. In order to survive, the organism
mobilizes a protective organ, the tumor, that replenishes the missing
substance. During pre-clinical phase of cancer, deficiency is slight and compensated
by a minute tumor. With time it gets worse and tumor has to grow more and more
in order to make up for the loss, causing pain and secondary damage to vital
functions. The patient seeks help and the disease starts its clinical course.
When deficiency intensifies, the patient dies in a state of decompensation,
known as crisis or relapse.
There is a disease called pernicious anemia that illustrates how
a tumor might be protective. It is triggered by a "carcinogen" preventing the
entry of vitamin B12 into the body. During its pre-clinical phase, that lasts
about two years, the patient is healthy. The clinical phase starts with anemia
and "paraneoplasia", known as combined degeneration of the spinal cord and brain.
The bone marrow displays "neoplastic" features, e.g., hyperplasia, maturation
arrest, and ineffective erythropoiesis, that were regarded in the past as "pseudo-leukemia"
(21). These are protective means by the bone marrow that keep the patient alive.
With time deficiency deepens more and more until reaching the state of decompensation
whereupon the patient dies.
|
Physician
|
Philosopher
|
||
|
Click on your icon
to follow your trail
|
|||