 |
Aging acceleration
The experiment starts when CA has reached
its steady state. The experimental clock is set to
t = 0. The time unit is one day.
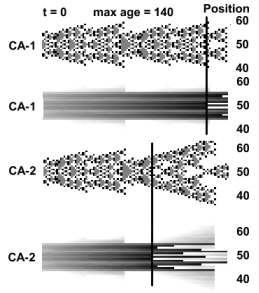
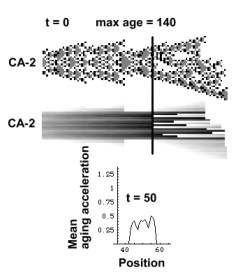
Max age =140. Cells older than 140 days die. The image below
depicts CA-1 and its age distribution. Then comes CA-2 and its age distribution.
The different shades of gray are proportional to cell age. White represents
age = 0, and black,
age = 140. The vertical line indicates where the age of the oldest
cell has reached age max, whereupon its age is set to 0 (white). CA-2
ages faster than CA-1 and cells reach age max earlier.
 |
 |
 |
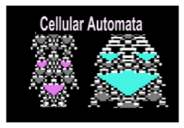
Biological age
Chapters 11, and 12 describe the nature of biological age. Processes in our body
age at different velocities, which is most conspicuous in tissues.
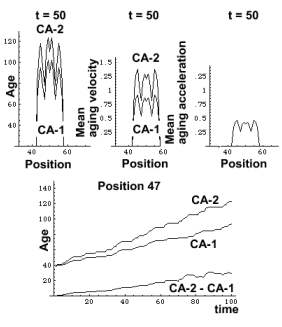
In the previous chapter cells aged at a constant
velocity (acceleration = 0). In the present experiments acceleration >
0. Age acceleration may fluctuate
between positive and negative values.
Further reading:
Streaming tissues
Setup
zygote -> effect[1, 1000]; go[63]; restoreparams; age[[2]] += 1.5 a[[2]];
effect[no, 140]; go[100]; restoreparams ; Do[age[[2, i]]+= (1 + 0.01 i)
a[[2, i]]]; effect[no, 140]; go [100];