 |
Aging acceleration-2
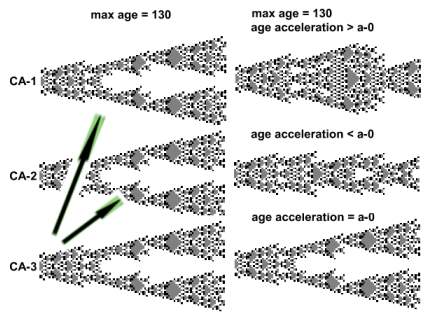
We continue to explore how CA aging can be controlled. In the previous experiment CA aging was controlled by CA product. In the present experiment, aging of CA-3 controls aging of CA-1 and CA-2. We start with three CA and set max age = 130. Aging acceleration of a cell in a particular position in CA-1 is proportional to the aging of a CA-3 cell in the same position. In CA-2 aging acceleration of the same cell is negatively proportional to the aging of the respective CA-3 cell. Which may be expressed as follows:
CA-1[aging acceleration, cell position]
= k * CA-3[aging, cell position]
CA-2[aging acceleration, cell position] = - k * CA-3[aging, cell position]
k; proportionality constant.
The arrows in the image below portray the direction of control. After the experiment starts, the structures of CA-1 and CA-2 change, while CA-3 remains unchanged. Aging acceleration in CA-1 and CA-2 is expressed in relation with that of CA-3. CA-3 acceleration in each position is a-0[position] (in short a-0).
 |
 |
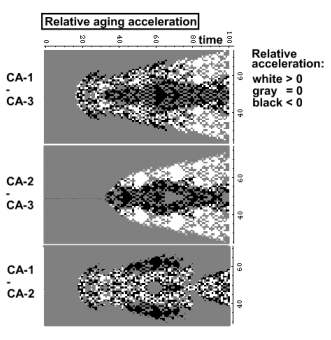
Below are three aging acceleration profiles. Each point
represents aging acceleration of a CA-1 cell relative to that of a CA-3 cell at the same position. White
cells indicate that the aging of a CA-1 cell is faster than the respective
CA-3 cell. Gray colored cells
age at the same velocity in CA-1 and CA-3. Black cells age slower.
 |
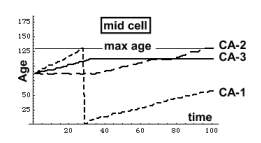
Although aging of CA-1 is accelerated by CA-3, the outcome
is not clear cut. Other factors also control aging, like the relationship
between max age and aging velocity, or the aging of the neighbors of a particular
cell. Take the CA-3 mid cell
depicted above. It stops aging altogether, yet the other keep on aging.
Setup
nca=3; zygote -> effect[no 1000]; go109]; restoreparams;
toaccel = 1; age[[no]] += a[[no]];
age[[1]] +=(toaccel a[[3]]); age[[2]] -=(toaccel a[[3]]); effect[no, 130]; go[100];
Next page